Easy way to forecast Growth and visualise your Unit Economics


Table of contents

Many of the startups that sprang up in the on-demand space over the last few years haven’t fared well. Take Homejoy, for example. Billed as the Uber for home cleaning, it began with a period of explosive growth but abruptly collapsed after 2 years.
The reason for their failure? They prioritised user growth over revenue growth. According to the Founder of the research firm Crowd Companies, each individual home cleaning was simply not profitable.
Unfortunately, they suffered from poor customer retention and a crippling cost of customer acquisition. In the end, their unit economics got the better of them.
I meet with businesses all the time that haven’t got a solid handle on their unit economics, and it has a marked impact on their ability to understand and prioritise activities that will grow their profits.
Because they don’t accurately project their profitability over time, they can’t see clearly which levers they need to pull to make a positive impact (by levers, I mean customer acquisition cost, pricing model, product to market fit, cost of production etc).
The basics of unit economics
Unit economics help you to understand if you are getting enough value from a customer to warrant the costs you are spending on acquiring and retaining them and creating and servicing your product. A unit economics analysis will help you to project how profitable your company may (or may not) be, identify when it can expect to reach profitability and distinguish which strategies will work best to influence that.
The accepted definition for unit economics is “Unit economics are the direct revenues and costs associated with a particular business model, and are specifically expressed on a per unit basis”
Most startups will begin with inefficient, negative unit economics and take a few years to end up with profitable unit economics (and some unicorns may never get there).
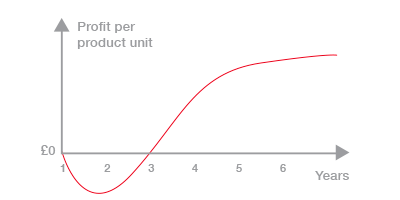
Above is a typical growth curve for a startup - which starts to see profitable unit economics at year 3. For a startup to reach this point, changes will have been made to a combination of factors, like reaching a critical mass of customers, reducing the cost of acquiring those customers or reducing the cost of producing the product.
An easier way to calculate unit economics
Most unit economics calculations require you to know your customer lifetime value (LTV). Since this can be quite difficult to calculate, we suggest simply looking at revenue over a single year period instead. A year provides enough time to accurately observe the natural rhythms of your business - for example, customers can unsubscribe or churn, new competitors can enter the market, or you could develop new products. You can look at a retrospective year, estimate numbers for the current year, or do both.
We also advocate thinking in terms of product units (think of a product unit as a software license or a single month from a monthly subscription or a single product) as this offsets your customer acquisition cost (CAC). For example, acquiring 1 customer who purchases 3 products from you effectively divides your CAC by 3. It is surprising how often startups fail to factor product units into their calculations.
Here are the numbers you need to know to start the analysis (all numbers are over a 1 year period):
- A) Total cost of acquiring and keeping customers
- B) Projected number of customers
- C) Total cost of producing & servicing products
- D) Projected number of product units sold
- E) Average number of product units sold per customer
- F) Product unit price
Now to start the analysis:
Cost of acquiring and owning a customer unit: A / B (= G)
Cost of producing a product unit: C / D (= H)
Cost of acquisition per product unit: G / E (= I)
Profit by product unit: F - H - I
Here’s an example for Alto Co., a fictional company with a SaaS product.

Projecting unit economics
This is the fun part. By projecting different scenarios based on hard variables, you can begin to get an idea of how your unit economics will shift in particular scenarios, AND what you could do to best prepare for those challenges.
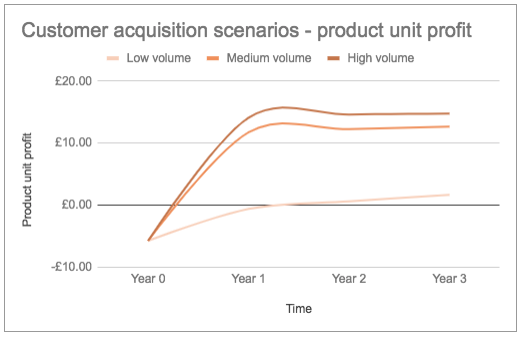
In the diagram above, different customer acquisition volumes have been projected over a 3 year period to demonstrate how the unit economics would change in each scenario.
It’s important to take into account the efficiencies you expect to gain over the years when projecting your costs for the next few years. For example, you might expect to become more efficient at acquiring customers or reduce costs by getting a better supplier deal.
For a step-by-step, easy and quick way to forecast and visualise your unit economics, try out our Growth Economics calculator.